Spatial thermal imaging as a method of diagnostics of power substations
 Thermographic inspections and spatial thermography in the energy sector
Thermal imaging cameras for construction
The human eye can detect a hot object from a certain temperature, depending on the material of the object. As the temperature increases, the spectrum of blackbody radiation shifts towards shorter wavelengths, according to Wien’s law:
λmax=b/T
where λmax is the maximum of the observable spectrum, T is temperature, and b is Wien’s constant. This means that a material whose temperature is different from absolute zero always emits thermal radiation, which changes from infrared to visible spectrum as the temperature increases. Thermal images of the surface of an object with a relatively low temperature are only possible with infrared thermography.
The first use of thermal imaging cameras by monitoring and maintenance services to control the power energy infrastructure in substation areas appeared in the late 1980s. Temperature anomalies in power infrastructure appear due to current unbalance, micro-cracks in the surface, contact and connection problems, voltage spikes and drops, and other similar problems. Regularity in detecting potentially dangerous places for the operation of the entire power system results in an increase in the level of reliability and acquisition of knowledge about the life cycle of individual elements of the power infrastructure. In this article, the reader will learn about a modern temperature imaging technique that helps detect failures before they occur.
Thermal imaging research
In Poland, each distribution and transmission company conducts periodic thermal imaging inspections of power grid elements. The quality of the collected information depends on many factors, such as setting the appropriate emissivity factor, the temperature difference between the object and the background, the distance from the object and others. Therefore, the process of performing thermal imaging measurements should be done by specialized groups that can provide full information along with an appropriate assessment. From technical studies and articles available on the web, it can be concluded that the dependence of the quality of information carried by a photogram obtained during a thermal imaging examination depends on many factors. The most important are listed below:
- Influence of the emissivity factor
Emissivity is the ability to emit infrared radiation. It ranges from 0 (for a mirror) to 1 (perfect blackbody). Incorrect selection during the calibration of the thermal imaging camera before measurements may result in a significant temperature difference, usually its underestimation, which is the case with objects with lower emissivity, such as copper or aluminium, for which this value should be much lower (0.1-0.4 ) from the standard ones (0.9 according to the DL/T 664-2008 standard). - Temperature difference between the tested object and the background
Measurements should be avoided on sunny days. The best conditions are provided by a windless night or a cloudy evening with a temperature above 0°C, with the devices turned on at least 6 hours earlier. The sunlit background of the tested object affects the reading – the higher the temperature difference, the lower the uncertainty of the test. - Distance from the measured object
The quality of the temperature reading decreases with distance. The reason is the limited area of the semiconductor matrix that receives infrared waves. In modern cameras, information from individual cells is interpolated live and smoothed, resulting in a higher resolution image, which is the effect of the interpolation function. Therefore, radiation from a distant object will fall on a smaller surface of the matrix, and information about the temperature on its edges will be the average of the temperature of the object and the background – the algorithm will “smooth” it at the edges. An object observed from a closer distance will be less susceptible to distortion of information.
The conclusion is that experience in manual measurements is crucial. Some parts of the power infrastructure is prequalified for accurate “on-the-fly” measurements, but some areas may still be missed from a maintenance point of view. Simultaneous acquisition of a photogram and initial diagnostics is a standard in some enterprises, therefore thermal imaging measurements should be outsourced to specialized groups for a full process with a report and recommendations. In order to avoid errors, a tool for collecting complete information using digital techniques is needed, and spatial imaging will be the solution obtained.
Thermal imaging
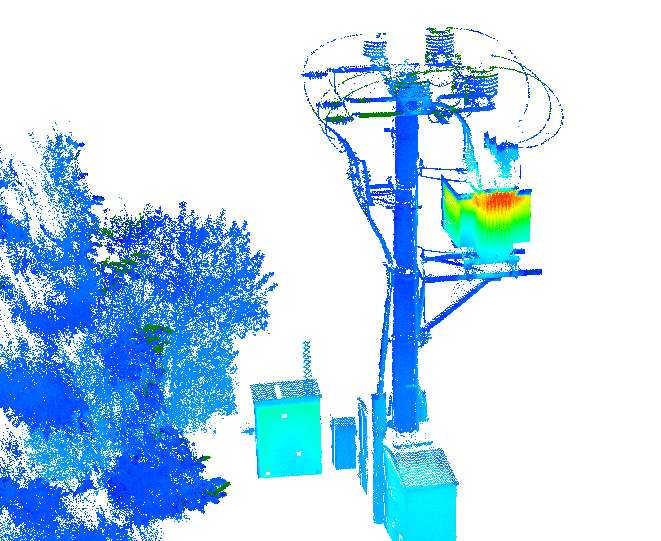
In the area of power grids infrastructure of transmission, distribution powerlines and substations, systematic thermal laser scanning included in the Condition Monitoring System (CMS) allows for easy diagnostics of the entire substation in one go, where spatial data is collected in a relatively short period of time with a known load of the tested system. The collected point cloud is coloured, giving each point the temperature value from the photogram (Fig. 2). In this way, the archival 3D model is used for an easy inspection of the current state and allows you to compare the state from previous inspections, showing the aging of the particular infrastructure parts.rzenie elementów.
Przykład: Skaning termowizyjny stacji elektroenergetycznej
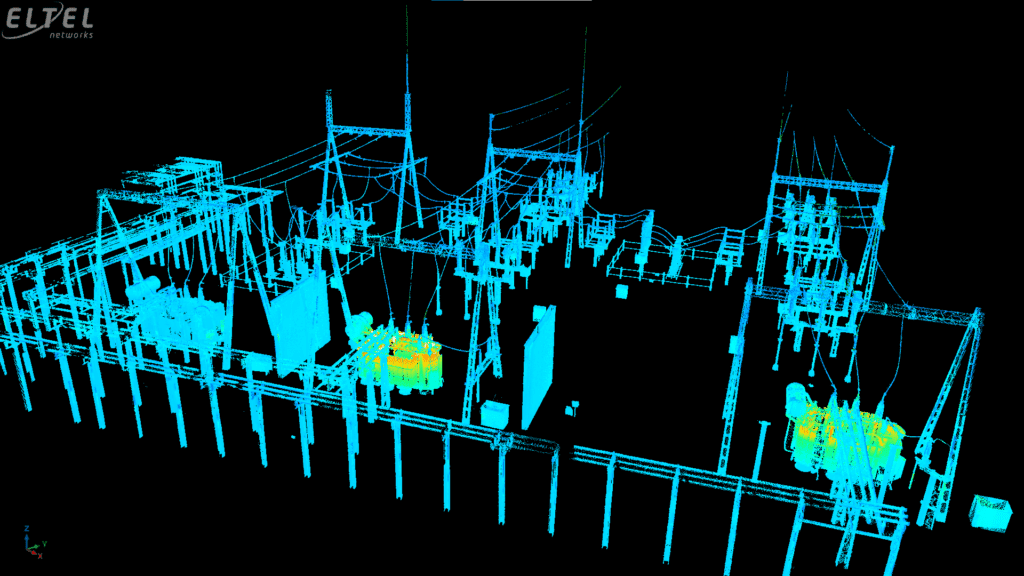
Przyzakładowa stacja elektroenergetyczna (rys. 3) o powierzchni 60 x 60 m została zeskanowana z 12 pozycji w czasie ~1 godz. Obróbka pozyskanej chmury punktów zajęła ~3h. Raport z przestrzennych oględzin termowizyjnych był gotowy na następny dzień.
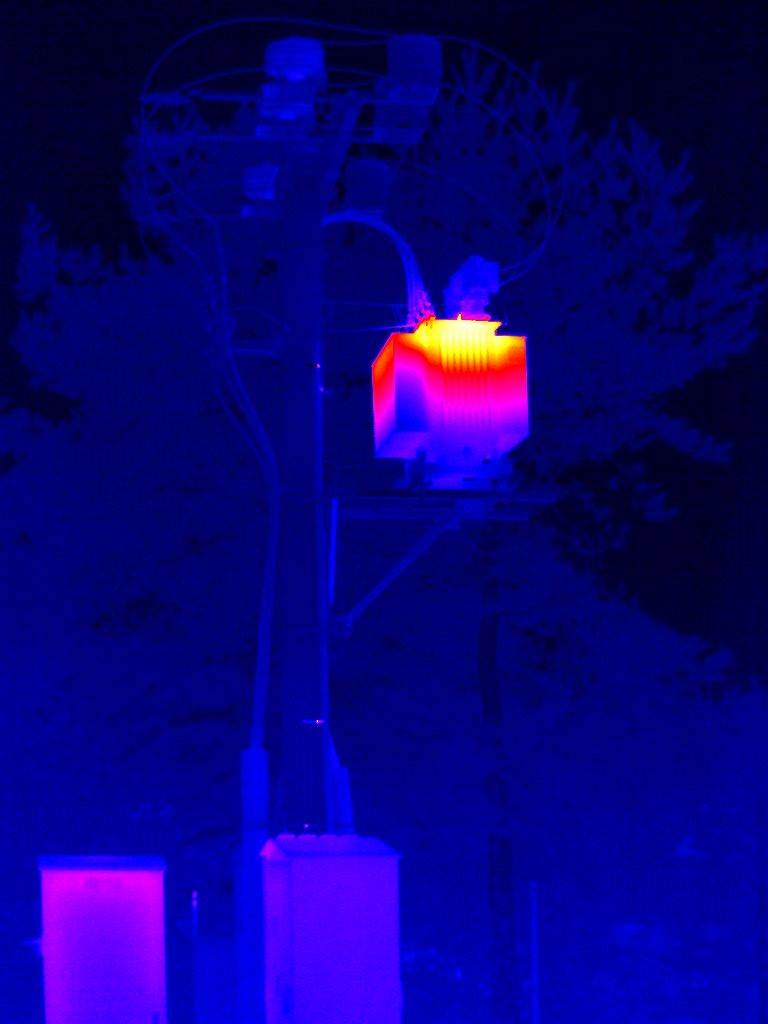
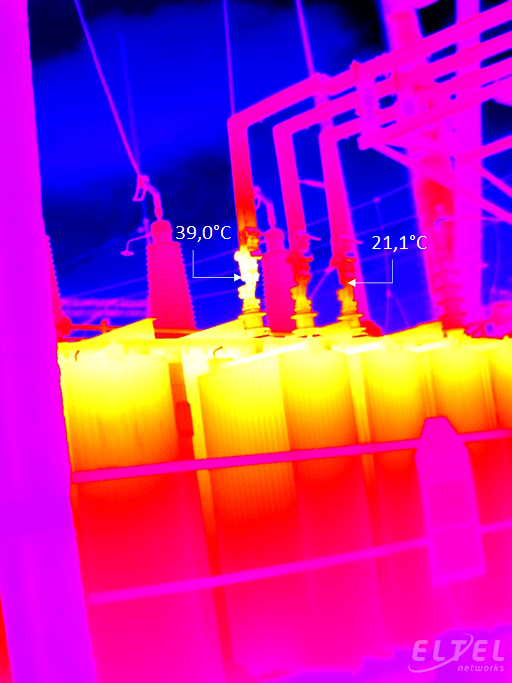
Dzięki oględzinom 3D (rys. 4) przestrzenne informacje można filtrować globalnie w zadanych zakresach, wskazując elementy o zadanych temperaturach – normalnych (tła), jak i różnej skali przekroczeń. Jako raport otrzymuje się chmurę punktów oraz wyszczególnienie przefiltrowanych lokalizacji z opisem, takich jak przykład na rys. 5 (fotogram pozyskano w trakcie skaningu).
Author: Filip Ratkowski